If you want to view the statistics on the expenses for this month (for example), it is necessary for you to:
1. Open the side “Menu” and to go the "Feed".
2. Click on the "Expenses and income" above the chart.
3. In a drop-down list click on "Expenses".
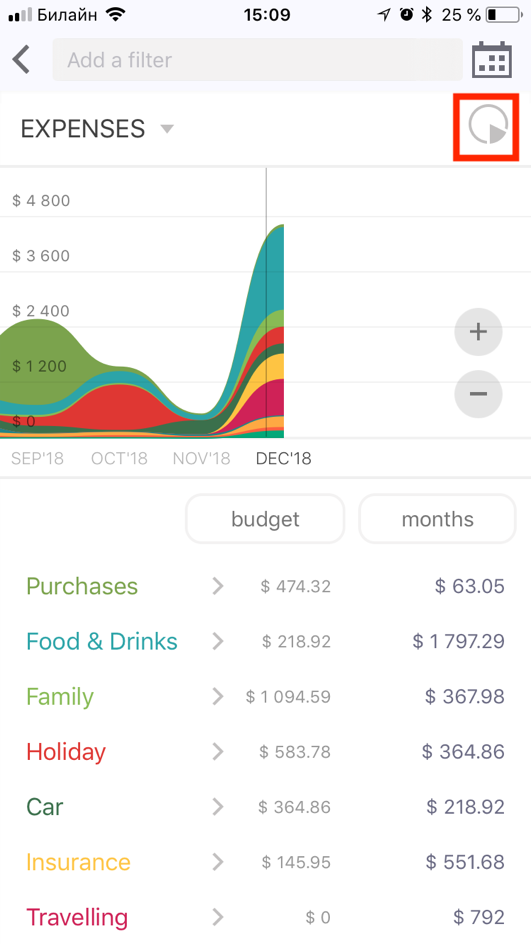
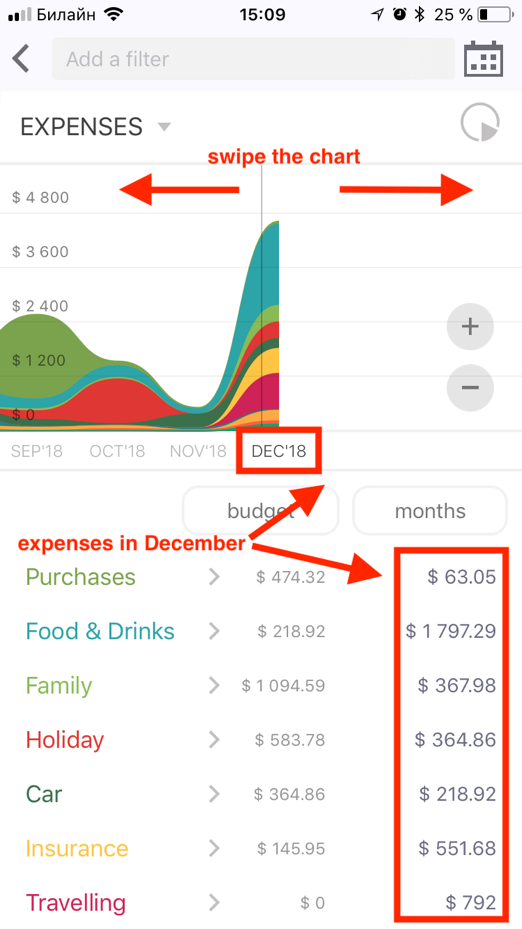
You will see a colorful chart.
Every color designates a certain category for which you spent money during the set period. Click on "Show all" under the chart, and you will see the names of categories matching the colors of the chart.
You can swipe left, so you will be able to see the Income for the previous periods.
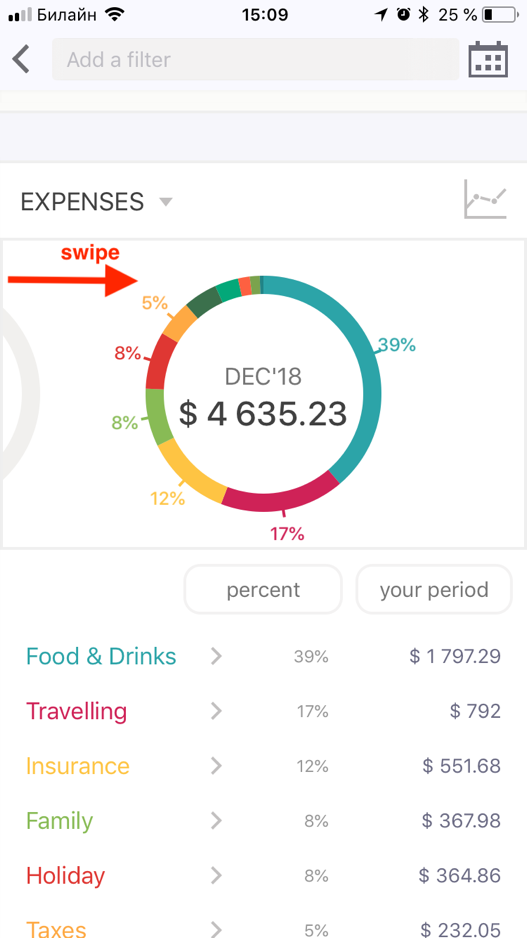
You can display statistics of expenses in the form of a pie chart.
For this purpose, click on an icon of the circular chart in the right top corner under the "Calendar" icon.
To see statistics of expenses for the previous periods in the form of circular charts, swipe from left to right.